Tackling the Learning Crisis: Data-Driven Decision-Making in Ghana's Education System
The Impact of Data-Driven Decision-Making on Learning

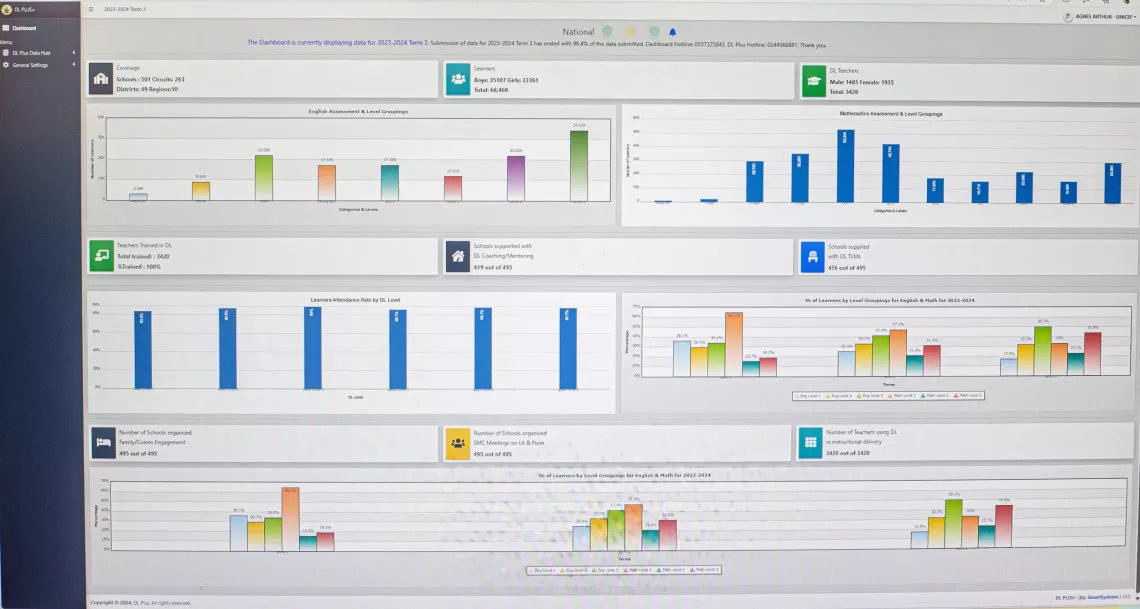
In the bustling corridors of Ghana's schools, a quiet innovation is taking root—one driven by data, collaboration, and a shared commitment to transform education for every child. At the heart of this transformation lies the 'Differentiated Learning Plus (DL+) Dashboard,' a pioneering initiative that is reshaping the way student, teacher, and community data are collected, analyzed, and utilized.
Globally, the learning crisis is stark with 70 per cent of children in low- and middle-income countries cannot read and understand a simple text by age 10. In Ghana, 80 per cent of children still do not acquire basic skills in literacy and numeracy by the end of primary school.
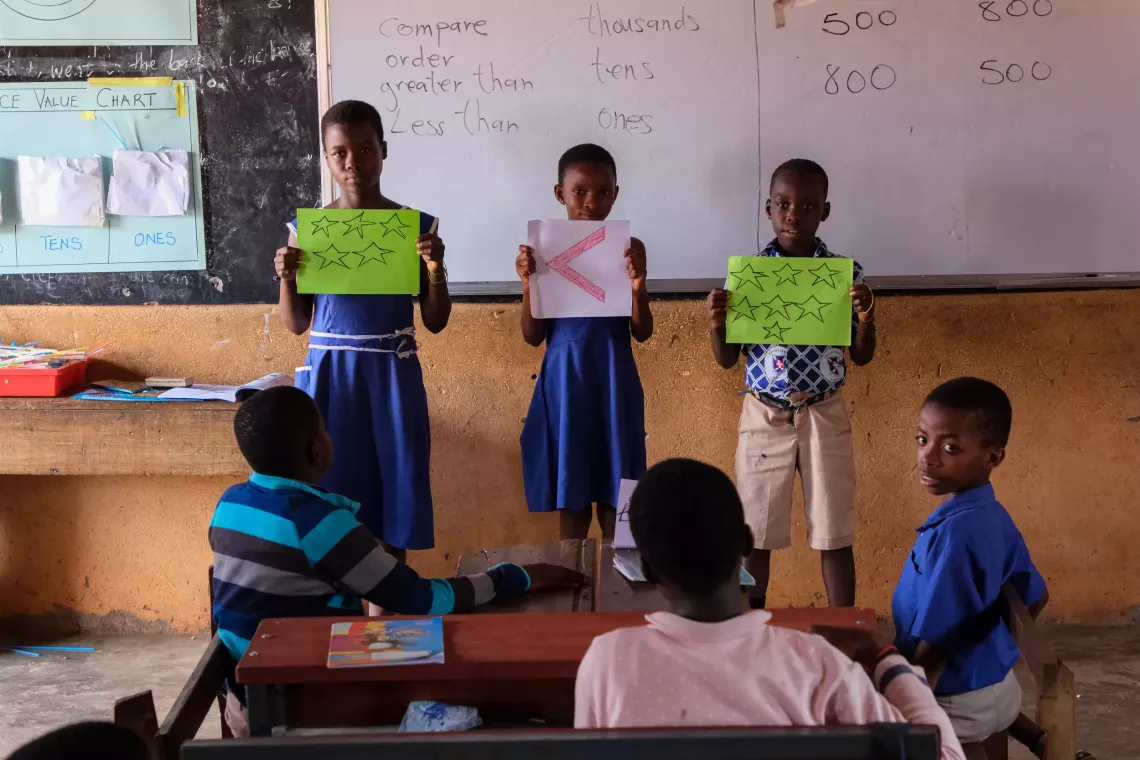
Ghana’s DL+ programme, supported by UNICEF and the Gates Foundation, aims to address this learning crisis through the evidence-based Teaching at the Right Level (TaRL) approach, which tailors instruction to each student's ability level rather than age. The DL+ programme is being implemented in Grades 2 to 6 across 501 schools, with plans to expand to all 10,000 primary schools in Ghana in coming years.
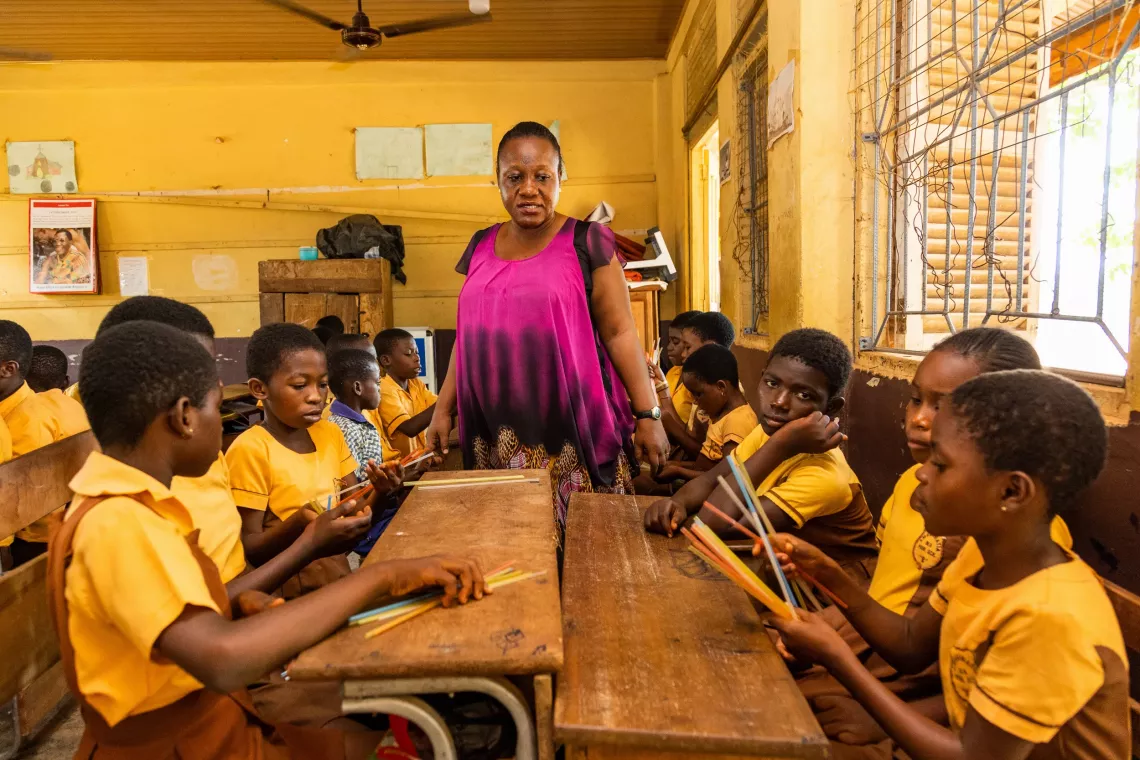
Targeting instruction by learning level rather than age or grade has proven to boost reading and math outcomes while fostering inclusivity and equity in the classroom. However, inherent in this approach is the need for regular assessments and tracking of each student’s learning, a component that is critical not only for understanding each child’s progress but also to make timely and informed decisions around programme strategies. This tailored approach demands significant extra time from teachers to regularly assess each child and manually record and track their progress. It is also crucial for headteachers, principals, and district and national-level administrators to access this data in real-time to address challenges and gaps efficiently.
A Call for Data-Driven Solutions
Despite existing systems for collating learning data in Ghana, a critical gap persisted—a manual, fragmented approach to data collection that hindered timely decision-making and impacted learning outcomes. Ghana recognized that the success and scalability of the DL+ programme depended on data-driven decision-making and government ownership from the start
It was time for Ghana to adopt a proactive approach to data collection and analysis.
Enter the DL+ Dashboard: A Collaborative Solution
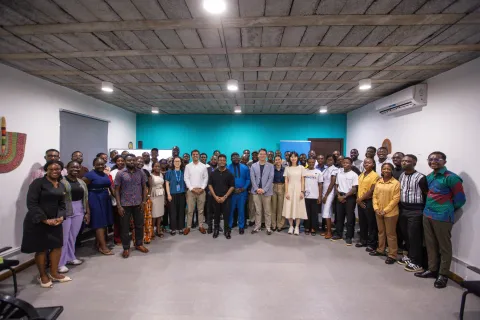
UNICEF in collaboration with the Government of Ghana and its key education agencies, endeavored to develop an all-encompassing tool that would consolidate assessment data, provide real-time insights, and empower stakeholders at all levels to make data-driven decisions. Government ownership and development were integral from the beginning, ensuring alignment with national education priorities.
Drawing on local expertise and global best practices, the dashboard is the locally grown solution provided by a passionate and innovative ICT statistics coordinator at the sub regional level. It was designed to align with Ghana's education priorities locally while incorporating key indicators that would allow Ghana to measure its progress in addressing the learning crisis against global targets. This solution was recognized at the national level to be a pathway to access authentic data that could be used for decision making. Its user-friendly interface and customizable features ensured accessibility for educators, policymakers, and community leaders alike.
"Coordinating inputs of all implementing agencies forming the Technical Working Group during the design of the dashboard has strengthened ownership and oversight by all. Now members can get real time data on teachers and learning progress of learners, through the dashboard."
"My motivation for developing the DL+ Dashboard comes from a longstanding dream to enhance Ghana's educational system by empowering GES to track and analyze student learning outcomes. Recognizing the potential of the DL+ concept to fulfill this vision, I was driven by the belief that accurate and accessible data could significantly improve education quality and student performance. This inspired me to create a tool that provides real-time insights for data-driven decision-making."
Unlocking the Power of Data: Features and Impact
The DL+ Dashboard represents a paradigm shift in education management for the country, offering a range of features tailored to address Ghana's unique challenges:
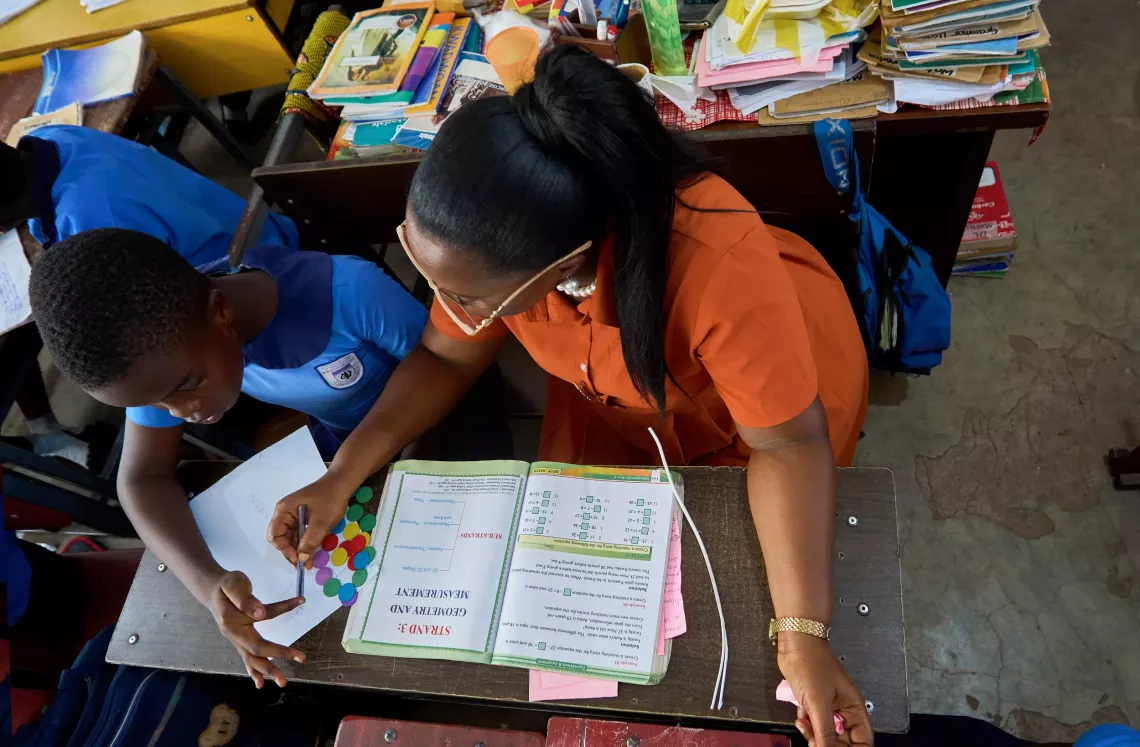
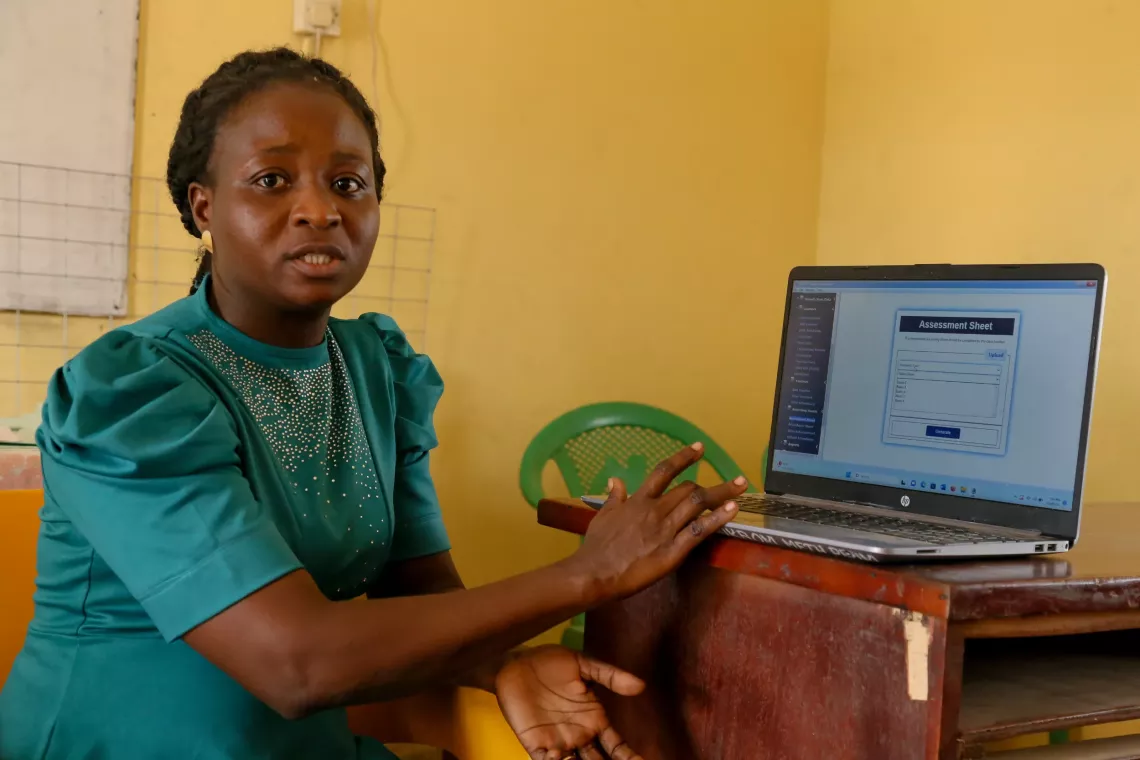
- Streamlined Assessment: By integrating various assessment tools and data sources, the dashboard reduces duplication and saves valuable teaching time.
- Real-Time Insights: Educators can access up-to-date information on student progress, teacher performance, and community engagement, enabling targeted interventions and support.
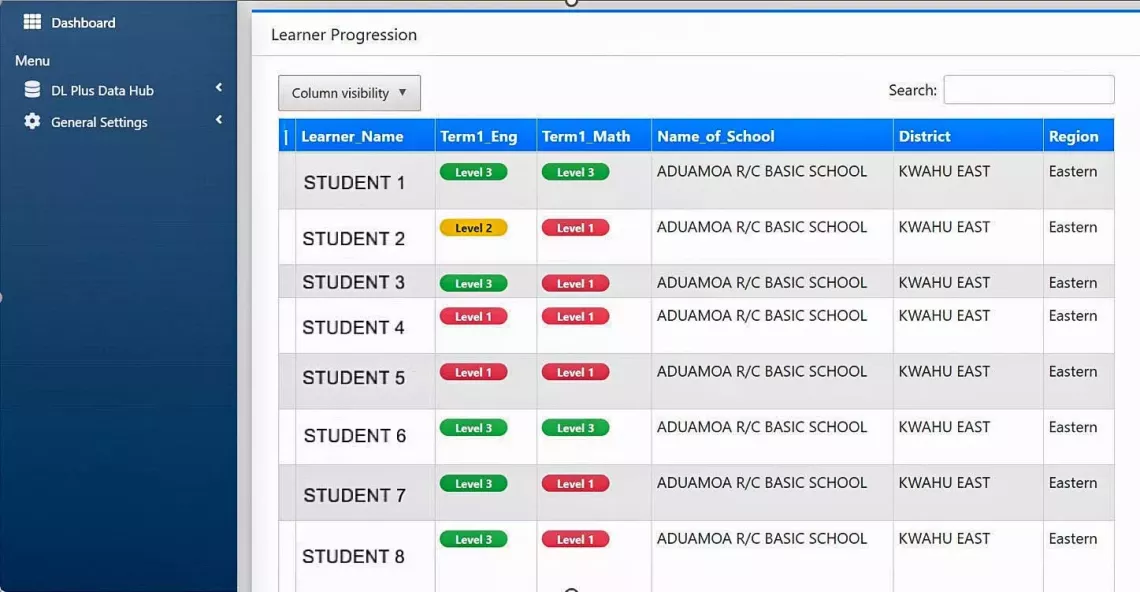
- Progression Tracking: Through the dashboard's progression matrix, stakeholders can monitor learning outcomes at the district, school, community and student levels, identifying trends and areas for improvement.
- Feedback Mechanisms: The dashboard facilitates communication and feedback loops, fostering collaboration between teachers, headteachers, district directors, and national authorities.
- Systemic Integration: The dashboard has been embedded into government systems, with shortcuts on officials' computers and training on its use to ensure seamless integration.
For teachers, the dashboard has not only allowed them more time for teaching, but it also provided a color-coded and easy-to-use system for quickly identifying which students were falling behind.
“I am very happy with the DL+ dashboard, especially the colour coding for our learners... the dashboard is helping me identify and support learners with specific skills, something we couldn't do before. We used to teach broadly in alignment with the curriculum without considering individual abilities."
The “community profiles” section of the dashboard is presented during meetings with parents and community members to show the number of students in each of the red, green and yellow categories. This feature has been especially useful in fostering wider interest and engagement in the process of improving student learning outcomes within each community.
Since its implementation, the DL+ Dashboard has catalyzed positive changes across Ghana's education landscape:
- Capacity Building: District directors, headteachers, and teachers have embraced data-driven decision-making, enhancing their analytical skills and accountability.
- Community Engagement: The dashboard has empowered families and communities, fostering greater involvement in students' learning journeys through its community-level school profiles.
- Scalability and Sustainability: With support from the Global Partnership for Education Multiplier Grant, plans are underway to scale up the dashboard's use nationwide, ensuring its long-term impact on learning outcomes.
Lessons Learned
The conceptualization and implementation of the DL+ Dashboard led to some key lessons:
- Data driven solutions require a collaborative approach and rigorous training at all levels for it to be impactful.
- Regular training on technology adoption and content is essential for effective classroom integration.
- Efficient implementation requires investments in training, technology, and infrastructure, leading to long-term benefits by facilitating timely decisions and improving learning outcomes.
The DL+ Dashboard exemplifies the transformative power of data-driven innovation in education and can serve as a template for other countries implementing or scaling similar approaches. As Ghana continues its journey towards quality, inclusive education for all, the dashboard stands as a testament to what is possible when data speaks and stakeholders listen.