Statistical data on COVID-19 in Ukraine
Daily and weekly reports on the situation with COVID-19 in Ukraine: information on communities, hospitalized patients, quarantine restrictions in educational institutions and other data
- Українська
- English
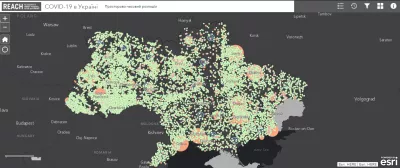
The Center for Public Health (CGH) of the Ministry of Health of Ukraine with the support of the United Nations Children's Fund (UNICEF) and the United States Agency for International Development (USAID) in partnership with REACH has developed analytical dashboards and online maps to perform detailed statistical multifactor and geospatial analysis - at the level of both the whole country and individual settlements - on the incidence of COVID-19.
COVID weekly forecast
The weekly forecast on the dynamics of the COVID-19 epidemic is based on the analysis of primary statistics on the epidemic in Ukraine. It includes the forecast of the spread of the epidemic in the regions of Ukraine (including fatality rate), as well as comparison of the previous week's data. Also, the analysis defines the reproductive number (which determines the rate of spread of COVID-19 infection per region) and the estimated proportion of hospitalizations.
Forecast of the COVID-19 epidemic in Ukraine for December 21, 2020 – January 4, 2021
Forecast of the COVID-19 epidemic in Ukraine in the period December 14-28, 2020
Forecast of the COVID-19 epidemic in Ukraine in the period December 7-21, 2020
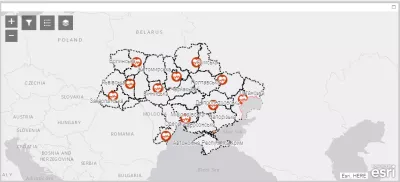
This dashboard presents the current situation with COVID-19 hospitalizations in dedicated hospitals based on a set of indicators. Namely, the share of occupied beds among those allocated for patients with COVID-19 (occupancy rate, %), the current number of beds occupied by patients with COVID-19, the total number of beds allocated for patients with COVID-19 and the current number of patients connected to ventilators (all types. The color of each district corresponds to the state adaptive quarantine zoning.
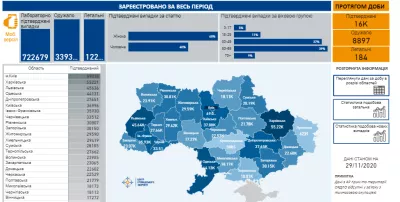
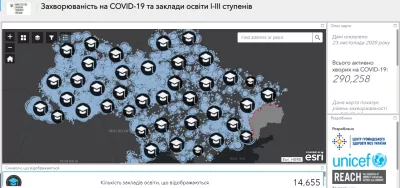
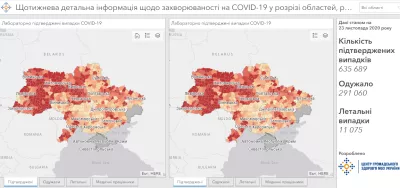
The spatio-temporal map presents the dynamics of detection of COVID-19 cases (including those among medical workers), deaths, recoveries and hospitalizations with a diagnosis of COVID-19 at the level of cities, towns, urban-type settlements, rural settlements and districts of Kyiv (subordinated to the Kyiv City Council). Methodologically, the map is based on the total number of laboratory-confirmed cases of infection, hospitalizations, recovery and death rates since the beginning of the pandemic, as well as their monthly distribution. Blue balls group the total number of active infections (people who are currently ill) on the date of the update.
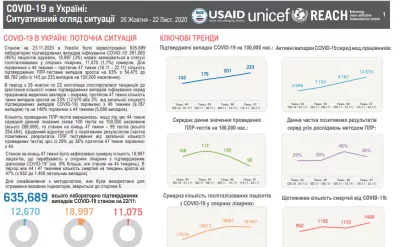
COVID Bi-Weekly Situation Overview
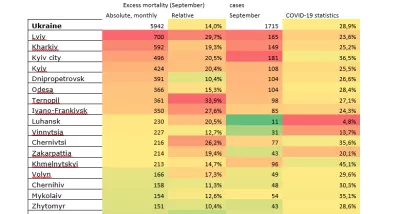
COVID-19 Situation Overview is set to present the key trends on COVID-19 developments in Ukraine over the last 4 weeks. In so doing, it presents both aggregated and disaggregated data (by region, gender and age groups) on COVID-19 confirmed cases, deaths, PCR tests (incl. positivity testing rate) together with cumulative totals of active hospitalisations and cases for healthcare workers. Additionally, the product includes a heat map to trace back the change in weekly average totals of confirmed cases per region and forecast of new cases for the next week.