About 90 per cent of children in Bhutan exposed to climate hazards, UNICEF report finds
THIMPHU, July 3, 2026 – Nearly 9 in 10 children in Bhutan are exposed to at least one climate hazard, with drought emerging as the most widespread threat, according to the Children’s Climate Risk Report 2026 released by UNICEF.
The report draws on the latest available data to assess children’s exposure to key climate hazards including droughts, floods, extreme heat, fires, and storms. It also provides new insights into how multiple risks overlap and affect children, as well as the essential services they depend on.
In Bhutan, about 85.7 per cent of children are exposed to drought, largely linked to changing rainfall patterns. Overall, 89.6 per cent of children are exposed to at least one climate hazard, while 19.6 per cent are exposed to two hazards.
Although fewer children experience the most extreme combinations of hazards, around 32 per cent are exposed to moderately high levels of combined climate risks. Children facing multiple risks are particularly vulnerable, as these impacts can compound and become more difficult to manage.
The report highlights that children’s climate risk is shaped not only by exposure to hazards but also by their level of vulnerability. In Bhutan, several factors increase children’s susceptibility to climate shocks. Only 4 per cent of children are covered by social protection programmes, early childhood education enrolment remains low at 38 per cent, and more than 1,300 children require inclusive education services. In addition, a large proportion of children experience violent forms of discipline, which affects their wellbeing and resilience.
These challenges reduce children’s ability to cope with and recover from climate related hazards such as droughts, floods, and heatwaves, increasing the risk of long-term impacts on their health, education, and wellbeing.
“The increasing frequency of floods, landslides, windstorms, and other climate-induced disasters across Bhutan underscores the urgent need to place children at the Centre of disaster risk reduction and climate adaptation efforts,” the Director General, Department of Local Governance and Disaster Management (DLGDM), Karma Galay said. “By strengthening early warning systems, preparedness, resilient public services, and local response capacities, we can better protect children and ensure that no child is left behind in the face of a changing climate. DLGDM remains committed to working with UNICEF and all partners to build a safer and more resilient Bhutan for every child.”
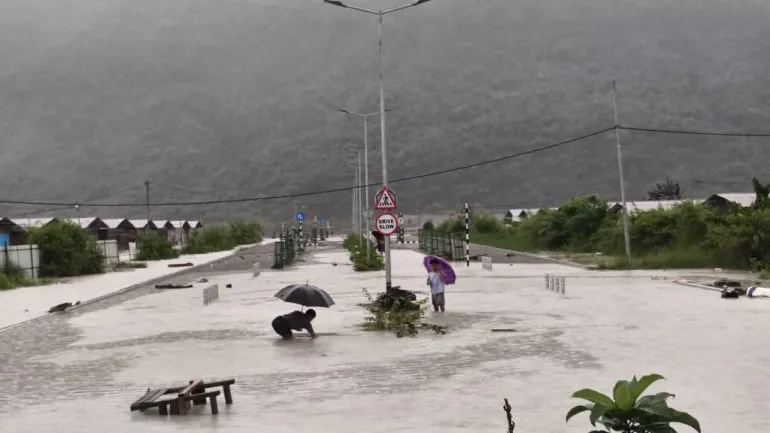
The report has come at a time when Bhutan is experiencing intense monsoon rainfall, highlighting the growing frequency and severity of climate-related hazards.
“The report provides critical evidence to guide planning and investment in services that protect children from climate risks,” UNICEF Bhutan Representative Rushnan Murtaza said. “Recent heavy rainfall and flooding across parts of the country are a reminder that these risks are not distant, and that children are already feeling the impacts. UNICEF remains committed to working with the Royal Government of Bhutan and partners to ensure that every child in Bhutan is protected and able to thrive in the face of a changing climate.”
The report calls for urgent need for stronger investment in climate resilient services and systems. Strengthening water, sanitation, health, education, and social protection services will be essential to reduce risks and protect children from the growing impacts of climate change. Without timely action, the escalating frequency and severity of climate hazards will intensify risks to children, placing greater strain on families, communities, and national systems.
###
Note to Editors:
Data for this analysis is part of the UNICEF global report Children's Climate Risk Report 2026. Additional information available here.
The Children’s Climate Risk Report 2026
Bhutan
The Children’s Climate Risk Report 2026 uses the latest available data to map children’s exposure to the most frequent climate threats, including droughts, extreme heat, fires, heatwaves, riverine floods, sand and dust storms, and tropical storms. For the first time, the report reveals exactly where – and how intense – multiple and overlapping climate threats are affecting children and the essential social services they rely on, and how governments can take concrete actions to respond.
The report also presents a framework to analyse the different types of risks children face, based on their exposure to climate shocks and their vulnerability, determined by access to essential social services such as healthcare, clean water, education, and more. The approach can be applied in different ways, from looking at risks related to individual or multiple climate hazards to examining risks across sectors, revealing the threats children face across different contexts.
Without urgent efforts to reduce greenhouse gas emissions, climate hazards will grow more frequent and severe, placing even greater strain on government budgets and systems, threatening children's well-being, the report warns.
This analysis can help governments and decision-makers plan better and invest more effectively in resilient services.
Single Hazard Exposure: The single hazard exposure assesses individual climate hazards, covering riverine floods, coastal floods, droughts (agricultural and meteorological), tropical storms, heatwaves, extreme heat, fires and sand and dust storm, as well as the two climate-sensitive hazards of vector borne disease (malaria as a proxy) and air pollution (measured as exposure to particulate matter PM 2.5).
The graph shows the percentage of children exposed to single hazards. As per the data, 100% of children in the country are exposed to air pollution (exposed to the particulate matter PM 2.5, threshold set by WHO) which includes all children in Bhutan. By climate hazards, most children in Bhutan are exposed to droughts.
Table 2: No. of children exposed to hazard combination
| |
| Hazard Combination | No. of exposed Children |
| Drought (agricultural and meteorological) | 135,392 |
| Drought + Fire | 24,993 |
| Drought + Heatwave | 7,187 |
| River Flood + Drought | 5,921 |
| Fire | 5,586 |
| Heatwave | 1,654 |
| River Flood + Drought + Fire | 1,061 |
| Drought + Heatwave + Fire | 544 |
| River Flood | 530 |
| River Flood + Drought + Heatwave | 182 |
| River Flood + Fire | 140 |
Multi-hazard exposure: According to the Global Child Hazard Database, 89.6% of children exposed to at least 1 hazard are considering climate hazards, 19.63% to at least 2 hazards, and less than 1% of children are exposed to at least 3 hazards.
| Percentage of children exposed to multi-hazard | |
| Multi-hazard exposure | Percentage |
| Percentage of Children Exposed to at-least 1 hazard (Droughts) | 89.6% |
| Percentage of Children Exposed to at-least 2 hazards (Droughts + Fire) | 19.63% |
| Percentage of Children Exposed to at-least 3 hazards (Droughts + Fire + heatwaves/ riverine floods) | 0.9% |
Overlapping hazards: The compound effects of two hazards, such as heatwaves and drought and floods, for which children are exposed at same time.
Table 2 shows that 135,392 children in Bhutan are exposed to drought only. The figure falls to 24,993 when drought is overlapped with fire. When drought, fire and heatwave overlap, the figure comes to 7,187 and 5,921 when riverine flood is overlapped with drought.
Multi-hazard intensity: Multi-hazard intensity is also expressed as percentiles, comparing exposure of children to multiple hazards at very high intensities across the world. The table below shows that 32% of children are exposed to Multi-Hazard Intensity (75th Percentile) followed by Multi-Hazard Intensity (80th Percentile) at 25.54%. Equal percentage of children are exposed to Multi-Hazard Intensity at 16 and 15% when measured at 85th and 90th percentile. The intensity of multi-Hazard is low for Bhutan and starts from minimal from 75th percentile which means 75th Percent of children lives below multiple hazards as compared to elsewhere and retains even at 80%. This further diminishes as we move to 95th percentile.
| Multi-hazard exposure | Percentage |
| Percentage of Children Exposed to Multi-Hazard Intensity (75th Percentile) | 32.14% |
| Percentage of Children Exposed to Multi-Hazard Intensity (80th Percentile) | 25.54% |
| Percentage of Children Exposed to Multi-Hazard Intensity (85th Percentile) | 16.14% |
| Percentage of Children Exposed to Multi-Hazard Intensity (90th Percentile) | 15.13% |
Vulnerability: The report also presents a framework to analyse the different types of risks children face, based on their exposure to climate shocks and their vulnerability, determined by access to essential social services such as healthcare, clean water, education, and more. The approach can be applied in different ways, from looking at risks related to individual or multiple climate hazards to examining risks across sectors, revealing the threats children face across different contexts.
Vulnerability includes the actual values of vulnerability indicators comparable across countries. The most vulnerable are children in Bhutan covered by cash transfer at 4% only, followed by under - 5 mortality at 17.17 per 1000 live births.
The girls and women of all ages who were first married or in union before age 18 is at 9% which still shows the existence of vulnerability.
As per the Annual Education Statistics Report 2024, only 38% of children are enrolled in ECCD leaving other children 3-5 years old to vulnerability.
The children who need special education are 1,326 as of 2024 EMIS and more being identified.
Percentage of children aged 1 to 14 years who experienced any violent discipline method in the past month as per the National Health Survey is as high as 82.8% which shows high vulnerability. Similarly, 29.8% of mothers/caretakers of children aged 1-14 years who believe that physical punishment is needed to bring up, raise, or educate a child properly.
Table 4: Indicators showing vulnerability of children in Bhutan
Indicator | Value |
| Children under five with a stunting z-score less than -2 SD | 17.87% |
| Percentage of women aged 20-24 years who were first married or in union before age 18 | 9% |
| Percentage of children under 5 covered by social protection | 4% |
| Under 5 Mortality (per 1000 live births) | 17.17 |
| ECCD enrolment | 38% |
| No. of children enrolled in Special Education | 1326 |
| Monastic Education Learners | 7944 |
| Percentage of mothers/caretakers of children aged 1-14 years who believe that physical punishment is needed to bring up, raise, or educate a child properly | 29.8% |
| Percentage of children aged 1 to 14 years who experienced any violent discipline method in the past month | 82.8% |
Annexures.
Single Hazard Exposure with data source
| Indicators | Value | Data source |
| Children (Under 18) Population | 204,635 | Worldpop, 2024 |
| Hazard Exposure Score | 2.11 | |
| Percentage of Children Exposed to Riverine Floods | 3.84 | Index of /ftp/jrc-opendata/CEMS-GLOFAS/flood_hazard |
| Percentage of Children Exposed to Droughts | 85.68 | FAO Agriculture Stress Index System (ASIS) |FAO, GIEWS, Earth Observation, Seasonal Global Indicators, METOP, NDVI, ASIS, VHI, VCI, ECWMF, Agricultural Stress Index, NDVI Anomaly, Vegetation Condition Index, Vegetation Health Index, Estimated Precipitation, Precipitation Anomaly Map |
| Percentage of Children Exposed to Agricultural Droughts | 6.64 | FAO Agriculture Stress Index System (ASIS) |FAO, GIEWS, Earth Observation, Seasonal Global Indicators, METOP, NDVI, ASIS, VHI, VCI, ECWMF, Agricultural Stress Index, NDVI Anomaly, Vegetation Condition Index, Vegetation Health Index, Estimated Precipitation, Precipitation Anomaly Map |
| Percentage of Children Exposed to Meteorological Droughts (spei) | 83.7 | TerraClimate - Climatology Lab |
| Percentage of Children Exposed to Meteorological Droughts (spi) | 29.74 | TerraClimate - Climatology Lab |
| Percentage of Children Exposed to Heatwave Frequency | 3.35 | ECMWF |
| Percentage of Children Exposed to Heatwave Duration | 2.04 | ECMWF |
| Percentage of Children Exposed to Heatwave Severity | 0.45 | ECMWF |
| Percentage of Children Exposed to Fires | 15.84 | NASA FIRMS |
| Percentage of Children Exposed to Fire Frequency | 5.06 | NASA FIRMS |
| Percentage of Children Exposed to Fire Intensity | 11.35 | NASA FIRMS |
| Percentage of Children Exposed to Air Pollution (PM2.5) | 100 | ACAG |
| Percentage of Children Exposed to Malaria | 3.71 | MAP |
Multi-hazard Exposure with link to data source
| Multi-hazard exposure | Percentage | Data source |
| Percentage of Children Exposed to at-least 1 hazard | 89.6 | UNICEF Data Warehouse |
| Percentage of Children Exposed to at-least 2 hazards | 19.63 | UNICEF Data Warehouse |
| Percentage of Children Exposed to at-least 3 hazards | 0.9 | UNICEF Data Warehouse |
| Percentage of Children Exposed to Multi-Hazard Intensity (75th Percentile) | 32.14 | UNICEF Data Warehouse |
| Percentage of Children Exposed to Multi-Hazard Intensity (80th Percentile) | 25.54 | UNICEF Data Warehouse |
| Percentage of Children Exposed to Multi-Hazard Intensity (85th Percentile) | 16.14 | UNICEF Data Warehouse |
| Percentage of Children Exposed to Multi-Hazard Intensity (90th Percentile) | 15.13 | UNICEF Data Warehouse |
| Percentage of Children Exposed to Multi-Hazard Intensity (95th Percentile) | 0.09 | UNICEF Data Warehouse |
Vulnerability with link to data source
| Indicator | Percentage | Data source |
| Percentage of children with DTP 1 immunization coverage | 98 | WHO/UNICEF estimates of national immunization coverage (WUENIC) |
| Percentage of children with DTP 3 immunization coverage | 98 | WHO/UNICEF estimates of national immunization coverage (WUENIC) |
| Percentage of mothers with skilled attendant | 98.5 | Joint UNICEF-WHO Database on Skilled Birth Attendance 2025 |
| Percentage of population with access to electricity | 100 | World Bank |
| Children under five with a stunting z-score less than -2 SD | 17.87 | UNICEF/WHO/World Bank Joint Malnutrition Estimates |
| Proportion of population with access to at least basic water | 99.55 | WHO/UNICEF Joint Monitoring Programme |
| Proportion of population with access to at least basic sanitation | 86.84 | WHO/UNICEF Joint Monitoring Programme |
| Proportion of population with access to basic hygiene | 94.52 | WHO/UNICEF Joint Monitoring Programme |
| Percentage of women aged 20-24 years who were first married or in union before age 18 | 9 | UNICEF Data Warehouse |
| Percentage of children under 5 are covered by social protection | 4 | UNICEF Data Warehouse |
| Under 5 Mortality (per 1000 live births) | 17.17 | UNICEF Data Warehouse |
Technical note:
To better understand the potential severity and frequency of climate threats throughout a child's life, the methodology uses a probabilistic model based on a 100-year return period. This approach captures extreme climate events that are highly likely to occur in any given year and highlights the most significant hazards children are exposed to.
This report includes updated data and models covering a broader range of hazards and vulnerabilities, compared to UNICEF’s 2021 The climate crisis is a child rights crisis report. The analysis now encompasses most countries and territories – including Small Island Developing States – and utilises a pixel-level multi-hazard approach, providing higher-resolution data at a gridded scale. Hazard data are now available for areas as small as 100 square kilometers in each country, with some hazards mapped at a 100-metre resolution.
*Landlocked Developing Countries (LLDCs) are developing nations that lack territorial access to the sea. Often, the development of LLDCs is constrained by isolation from world markets and high trade costs.
Media contacts
Additional resources
About UNICEF
UNICEF promotes the rights and wellbeing of every child, in everything we do. Together with our partners, we work in 190 countries and territories to translate that commitment into practical action, focusing special effort on reaching the most vulnerable and excluded children, to the benefit of all children, everywhere.
For more information about UNICEF and its work for children, visit www.unicef.org.