Social Indicators
Using non-traditional sources of data to understand indicators like household poverty, in real-time.
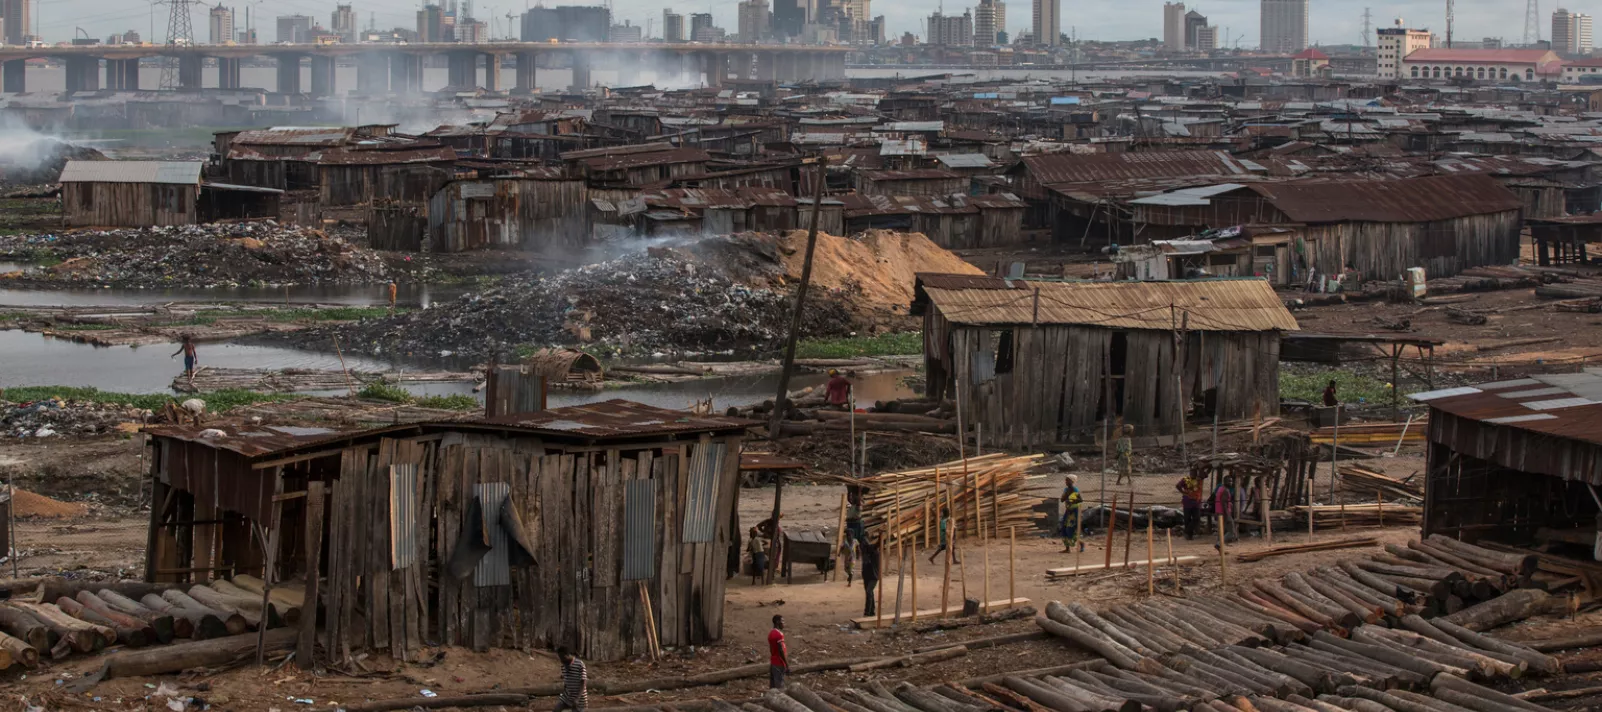
Humanitarian organizations, governments, and policy-makers in low and middle income countries are usually forced to make decisions based on limited data typically collected by means of household surveys.
New approaches to estimating demographic factors.
With information becoming more accessible, we are now able to overcome some of the limitations of traditional surveys by collecting data in faster, cheaper, more reliable and dynamic ways– which can be used effectively for policy advocacy and in identifying areas in most need of development and support. These data sources have also led to new approaches to estimating demographic factors. High-resolution, open source, satellite images as well as the digital breadcrumbs people leave when they use modern technologies such as mobile phones–can now create accurate maps of demographic indicators such as poverty and unemployment.
The work we do.
Multiple studies have shown that we can leverage new sources of data to estimate human characteristics such as literacy, poverty, and unemployment. At the Office of Innovation, we look into combining traditional household surveys and untraditional unstructured data to achieve results faster and to bridge the gap for years where official estimates are unavailable. Using human activity patterns such as mobility and activity, social media data from Twitter and Facebook, remote sensing such as high-resolution day-light or night-light satellite images, and techniques spanning from AI, network analysis and complex systems, to estimate and map the socio-economic status of a country’s population.
A closer look.
Using machine learning, UNICEF is involved in mapping poverty in Iraq. In collaboration with a local telephone service provider, UNICEF aims to create robust, real-time maps of various social indicators, enabling the government to monitor vulnerable communities and identify where to invest their scarce resources. Below are a some (but not limited to) data-sources we are leveraging for this project:
Mobile Phone
Aggregated and anonymized features from CDRs (Call Detail Records) are used for training different machine learning algorithms where the last available national survey is used as ground truth.
Examples of mobile features that have previously been shown to correlate with poverty include the frequency and amount people ‘top-up’ their account with, how many mobile phone users a region has, their calling, texting, and data activity. As well as mobility features of how and where people move around, and how individuals distribute time on their social networks.
Satellite Imagery
Remote sensing data has evolved considerably during the last years and we can now access different type of satellite imagery, ranging from night-light images, high-resolution day-light images, radar and heat images, etc. We are actively testing how this new available data and image processing techniques can contribute to socio-economic indicator estimation. For instance, identifying structures from satellite images such as buildings, roads, human settlements and quantifying the quality of these structures such as what type of roofing is used on houses is a great proxy for socio-economic factors.
A practical example: measuring child poverty in Iraq

The UNICEF Country Office in Iraq is exploring innovative and alternative ways of regular monitoring of child poverty and deprivation to strengthen responses to the rapidly changing context in the country. UNICEF is partnering with one of the main mobile network operators (Zain) in Iraq to conduct the analysis of their datasets from 2014 to now, and will then customize the most appropriate method that could be employed in the context of Iraq to establish a regular child poverty monitoring mechanism. As a result of this pilot, a method and algorithm for measuring poverty based on real-time data will be developed and published, as a key socio-economic indicator layer to the Magic Box platform, allowing the government and National Institute of statistics to bridge the gap between years where official measurements are unavailable and to construct dynamic measures that can be continuously updated.